Information Visualization Notes and Records
D3 Application
Good and easy online website to draw a Infographic
- Canvas (the china mianland version is mostly free to use)
Storytelling about Covid-19 - LIFE of LI
Online Presentation —— constrained(only use D3 and no other plug-ins or frameworks)
Preparation
- Very good D3 example and implementation website - observablehq.com
- Base html with swig special effect
- Good examples: small man animation effect functioned by scrolling from up to down / 3D special effect with zoom function / The New York Times - football races - information dashboard
Information Visualization dashboard of GE2020
Online Presentation —— constrained(only use D3 and no other plug-ins or frameworks)
Preparation
- analysis about previews election date: about election time and timespan - sg_elections_cch
- Singapore Official election data
- js onine small tester - w3schools.com
- color code in javascript
MapBox
Official websit / Official demo / [official ]
Election Boundarys from Singapore offcial database / Small tool KMZ to GeoJson convertor
How to use mapbox to implement the function [mouse move in show popup and mouse move out unshow popup] meterial: Official document / Implementation
A excellent online implementation / Official website of ZaoBao GE2020 page
further explore: mapbox-gl github guide of installation / implementation about mapbox-gl - Blog / an interesting github program not successfully deployed / mapbox and python analysis - Blog
might useful: add a pattern to a polygon
D3 script to geojson
How to fix the problem that can not read loal files when testing in browser firefox error report
How to set Sublime Text to auto change lines in the view when one single line is too long
The much too high density of edge data could possible cause D3 crash and output a BIG SQUARE on the screen. So if this happens, try to use lower presion data. (Lower means much fewer coordinate point pairs). While on the other hand, this crash would not happen on Mapbox. It not vary hard to find out and understand. For example, CHOA CHU KANG of singapore in the official ge2020 boundary data. But at the same time, the EAST COAST is also very huge in the amount of coordinate pairs and it does not make D3 crash. So maybe the true reason still remain exploration. If you find something, I would be very pleasure if you share your discovery via email. :)———— After the test in the WEST COAST data, it could be sure that the problem lies in the to much detialed borders of districts data provided by goveronment, which is very hard for d3 to recongnize.
There is a slow but very useful way to handle this problem. I can just try to delete randomly some coordinate pairs and test if the output is valid. Again and again, the iteration of this process could finally focus on the real “bad points”. [Random select - Top2Down approximation - Down2Top approximaiton] is my approch.
This problem could also be fixed by changing data density of the geojson file.
Merge projects
- The html would possible automatically generate a opacity style with random value, it could be a headache.
put the line in the body title would kindly fix this problem1
<body style="/*! opacity:1; */">
- how to merge a html file with v3 and v4 of d3 framework:
download d3.v3 to local files and use d3.v3 as a local javascript.
You can see the project through this link
D3 usage notes
- D3Js.v5: …selectAll(…).data(…).enter is not a function ERROR
example: 03_D3_TSV_Loading.html
codes:1
2
3
4
5
6
7
8
9
10
11
12
13
14
15
16
17
18
19<!DOCTYPE html>
<html lang="en">
<head>
<meta charset="utf-8">
<title>D3: Loading data from a TSV file</title>
<script type="text/javascript" src="d3.js"></script>
</head>
<body>
<script type="text/javascript">
d3.tsv("employees.tsv").then(function(data) {
for (var i = 0; i < data.length; i++){
console.log(data[i].Name);
console.log(data[i].Age);
}});
</script>
</body>
</html>
Infographic
My classmates’ excellent works:
I have get the permission from my classmates, and I sort works by alphabetic order of their names.
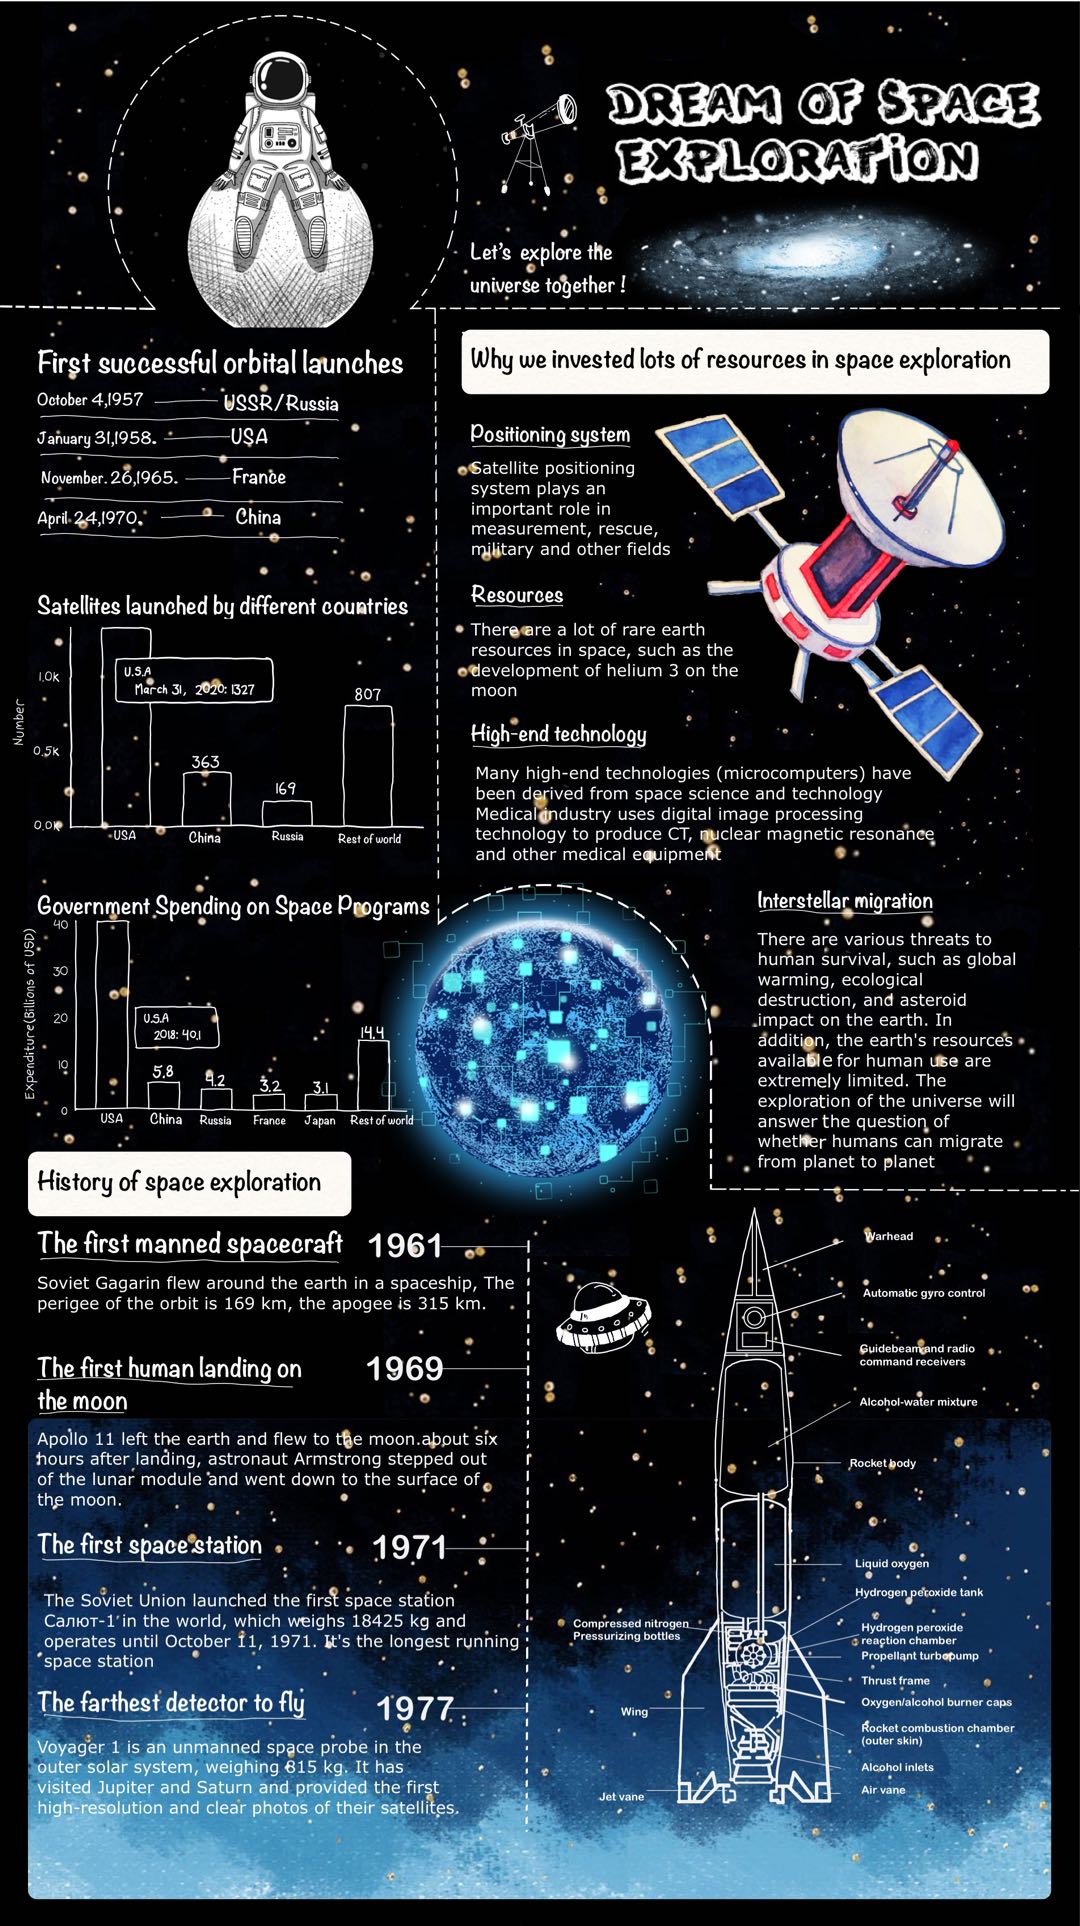
HUANG TIANTIAN - dream_space
HE XINYI - infographic_hxy
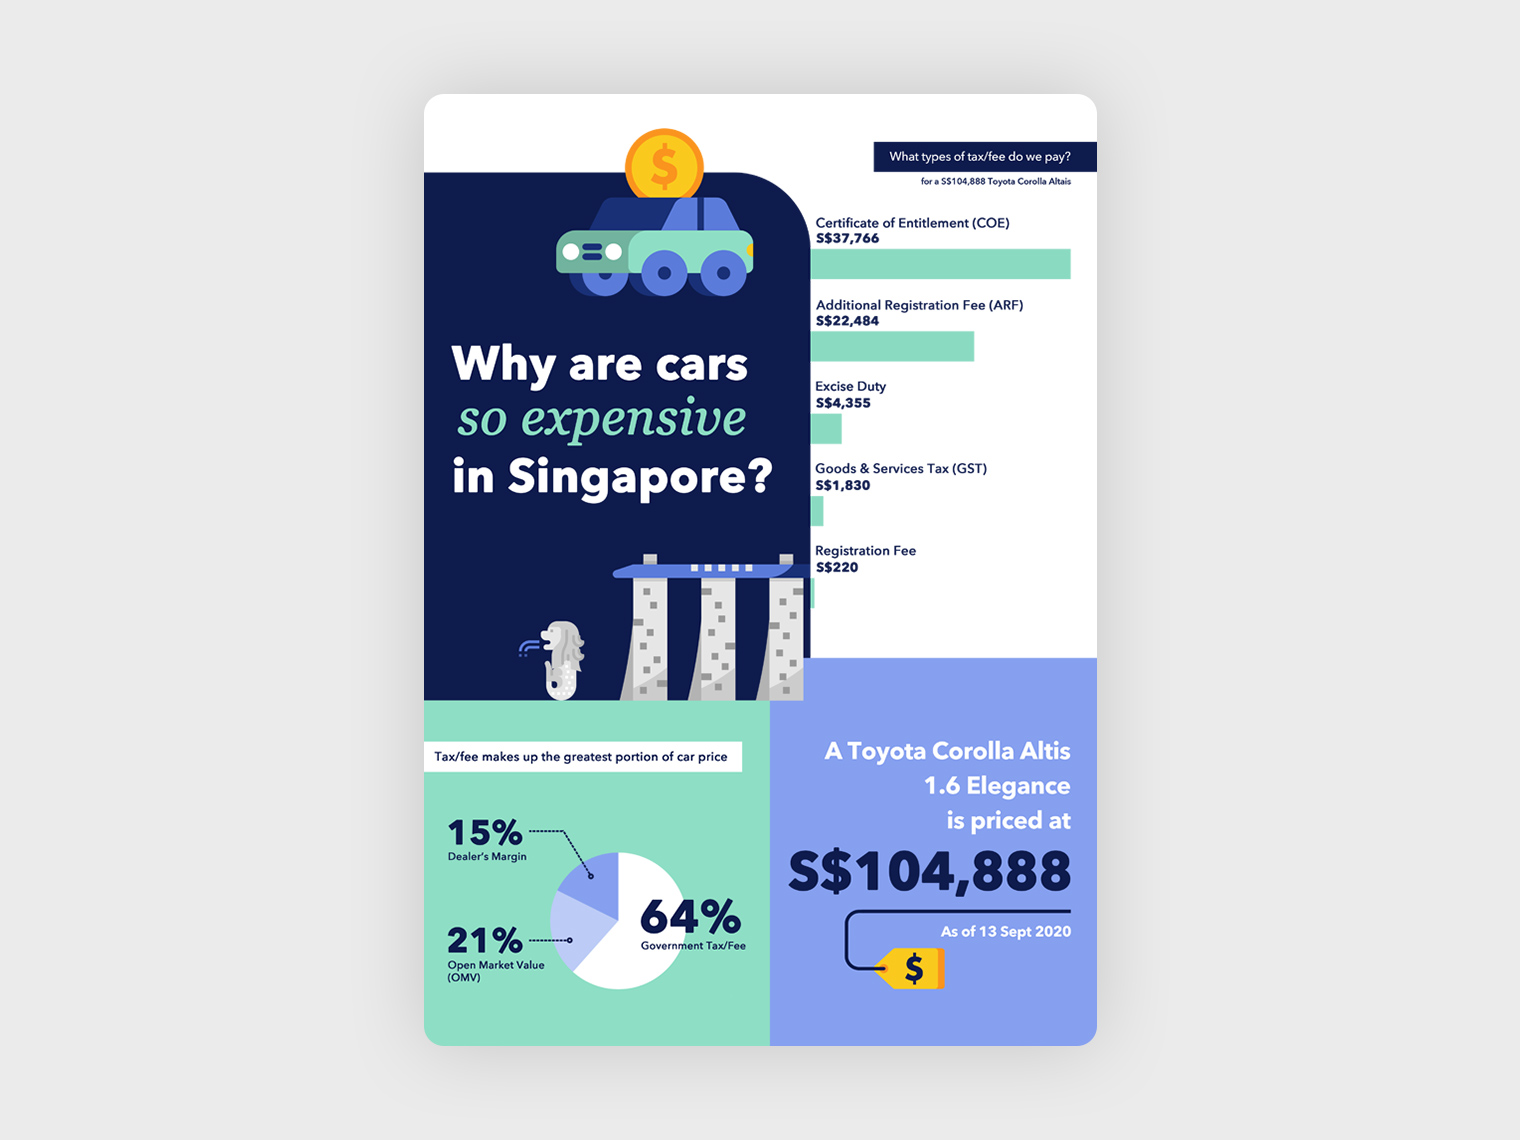
MA GUANGYI - why_are_cars_so_expensive_in_singapore
Dribbble LinkPETER LING CHONG TECK - cybercrime

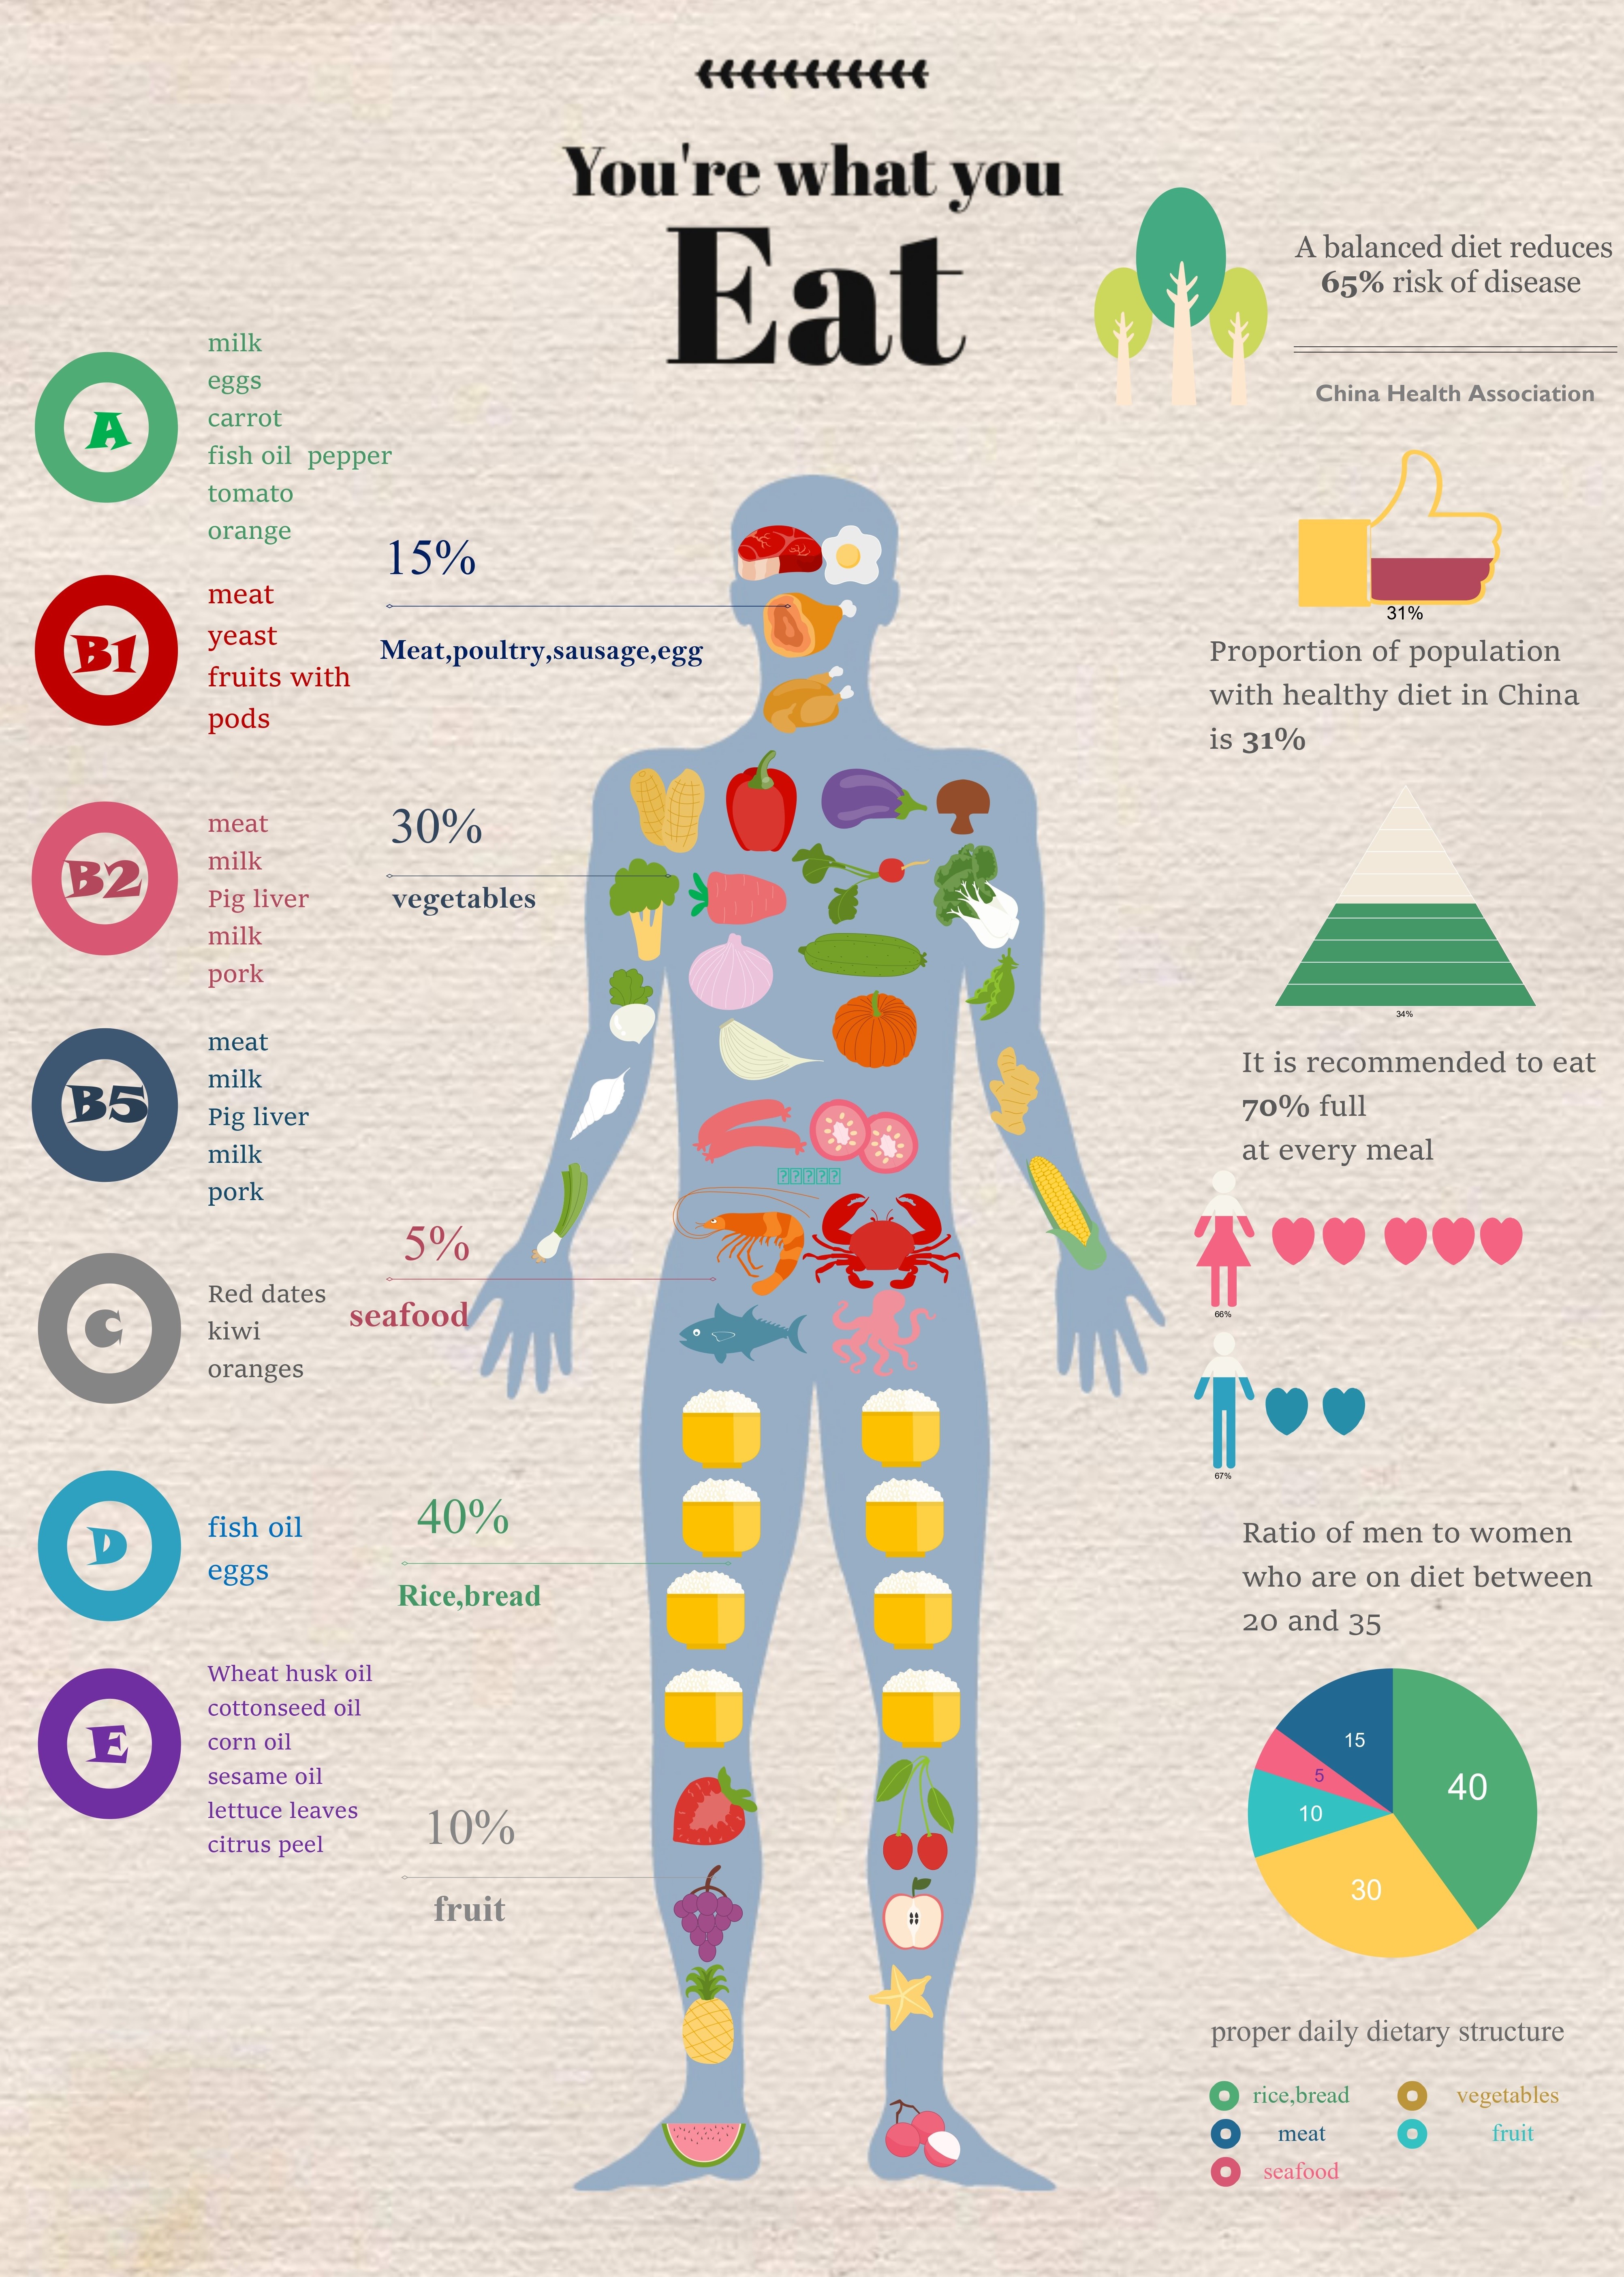
My self-made infographic and its report.

If you have any suggestions or ideas, I am very glad to recieve your letter. Feel welcomed to email me. :)
My email: fhuang181@gmail.com